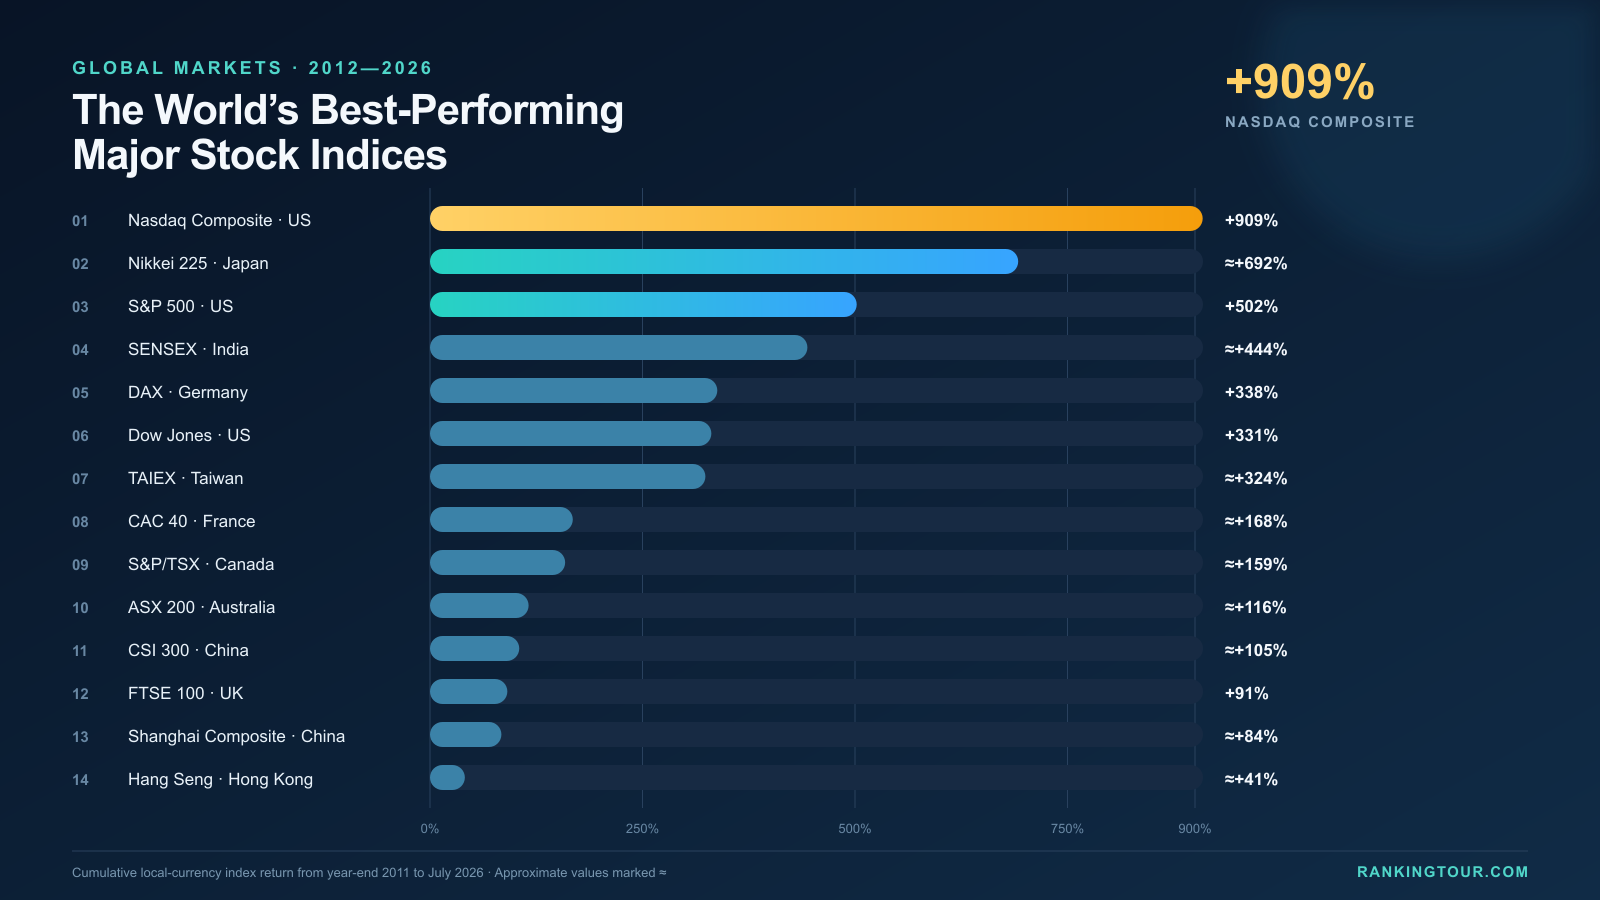
World’s best-performing major stock indices from 2012 to July 2026.
The world’s major stock markets have delivered dramatically different results since the beginning of 2012. Technology-driven U.S. indices dominated the period, Japan staged a historic recovery, and several European and Asian benchmarks produced much more modest gains.
Based on cumulative index performance from the end of 2011 to July 2026, the Nasdaq Composite ranks No. 1, rising approximately 909%. Japan’s Nikkei 225 follows with an estimated gain of about 692%, while the S&P 500 takes third place at approximately 502%.
The ranking below compares 14 widely followed stock-market benchmarks in their local currencies.
Important: These figures primarily represent index price changes. They exclude taxes, investment costs and currency effects. Dividends are generally excluded, although Germany’s commonly quoted DAX is a total-return index and therefore requires caution when compared directly with price-only indices.
Major Stock Indices Ranked by Gains Since 2012
| Rank | Stock index | Market | Approximate cumulative gain |
|---|---|---|---|
| 1 | Nasdaq Composite | United States | +909% |
| 2 | Nikkei 225 | Japan | ≈+692% |
| 3 | S&P 500 | United States | +502% |
| 4 | SENSEX | India | ≈+444% |
| 5 | DAX* | Germany | +338% |
| 6 | Dow Jones Industrial Average | United States | +331% |
| 7 | TAIEX | Taiwan | ≈+324% |
| 8 | CAC 40 | France | ≈+168% |
| 9 | S&P/TSX Composite | Canada | ≈+159% |
| 10 | S&P/ASX 200 | Australia | ≈+116% |
| 11 | CSI 300 | China | ≈+105% |
| 12 | FTSE 100 | United Kingdom | +91% |
| 13 | Shanghai Composite | China | ≈+84% |
| 14 | Hang Seng Index | Hong Kong | ≈+41% |
*The DAX is generally reported as a performance index that assumes dividends are reinvested. Most other benchmarks in this table are price indices.
1. Nasdaq Composite — The Clear Long-Term Winner
The Nasdaq Composite delivered the strongest performance among the major indices in this comparison. Its rise was powered by the expansion of cloud computing, e-commerce, digital advertising, semiconductors and artificial intelligence.
Companies associated with the U.S. technology boom became some of the world’s most valuable businesses. This concentration created exceptional upside during strong technology cycles, although it also exposed the index to sharper declines when growth stocks came under pressure.
2. Nikkei 225 — Japan’s Historic Comeback
Japan produced one of the most striking market recoveries of the period. After decades below its 1989 bubble-era record, the Nikkei 225 finally moved beyond that historic peak in 2024 and continued advancing.
Corporate-governance reforms, higher shareholder returns, improved profitability, a weaker yen and renewed international interest in Japanese equities all contributed to the rally. The result transformed Japan from a long-term laggard into one of the strongest major markets since 2012.
3. S&P 500 — Broad U.S. Market Strength
The S&P 500 rose by roughly 502%, ranking third. Although it is more diversified than the Nasdaq Composite, large technology and communication-services companies still played a major role in its gains.
The index benefited from strong corporate earnings, share buybacks, low interest rates during much of the period and the rapid growth of the digital economy. Because the S&P 500 represents many of America’s largest companies, it remains one of the most widely used benchmarks for global investors.
India and Taiwan Outperform
India’s SENSEX ranked fourth with an estimated gain of about 444%. Rapid economic growth, expanding consumer demand, financial-sector development and increased domestic participation helped support Indian equities.
Taiwan’s TAIEX also performed strongly, gaining an estimated 324%. Taiwan’s central role in the global semiconductor supply chain was a major advantage as demand for advanced chips, data centers and AI hardware accelerated.
Europe Delivers Mixed Results
Germany’s DAX ranked near the top of the European group, but its published performance is not directly comparable because the commonly cited version includes reinvested dividends.
France’s CAC 40 generated a more moderate gain, supported by global luxury, industrial and consumer companies. The UK’s FTSE 100 lagged in price terms, although its relatively high dividend yield means its total shareholder return would be substantially higher than the price-only figure shown here.
Mainland China and Hong Kong Lag Behind
The CSI 300 and Shanghai Composite advanced far less than the leading U.S., Japanese and Indian indices. China’s markets faced several challenges, including property-sector stress, regulatory uncertainty, uneven economic growth and weaker investor confidence.
Hong Kong’s Hang Seng Index ranked last in this comparison with an estimated gain of approximately 41%. The index was affected by its heavy exposure to Chinese property, financial and internet companies, as well as shifting global capital flows.
Why Local-Currency Returns Can Be Misleading
This ranking measures each index in its home currency. An international investor’s actual result may be very different after converting returns into U.S. dollars, euros or another currency.
For example, a rising stock index can produce a weaker return for a dollar-based investor if the local currency depreciates. Dividends also matter: high-dividend markets such as the UK, Canada and Australia generally look better when measured on a total-return basis.
For the fairest cross-market comparison, investors should ideally examine:
- Total returns with dividends reinvested
- Returns translated into one common currency
- Inflation-adjusted performance
- Volatility and maximum drawdowns
- Taxes, fees and investability
Key Takeaways
- Best-performing major index: Nasdaq Composite, approximately +909%
- Strongest Asian benchmark: Nikkei 225, approximately +692%
- Broad U.S. benchmark: S&P 500, approximately +502%
- Notable emerging-market performer: India’s SENSEX, approximately +444%
- Lowest cumulative gain in the ranking: Hang Seng Index, approximately +41%
- Technology exposure was the defining advantage of the period.
- Dividend and currency adjustments could materially change the order.
Methodology and Sources
The comparison measures the percentage change between each benchmark’s closing level at the end of 2011 and its latest available or recent approximate level in July 2026. Values marked with “≈” use recent approximate index levels and should be refreshed before future republication.
Reference sources include official index and exchange publications, historical market data made available through Yahoo Finance, the Japan Securities Dealers Association’s historical fact books, and contemporary market-close reporting. Yahoo notes that global index historical data on its platform is supplied by Commodity Systems, Inc.
This article is for informational and educational purposes only. It does not constitute investment advice. Past performance does not guarantee future results.
Tags: stock-market-ranking, global-stock-markets, stock-indices, Nasdaq, S&P-500, Nikkei-225, Dow-Jones, DAX, FTSE-100, Hang-Seng, CSI-300, investing, 2026-ranking
About the Author