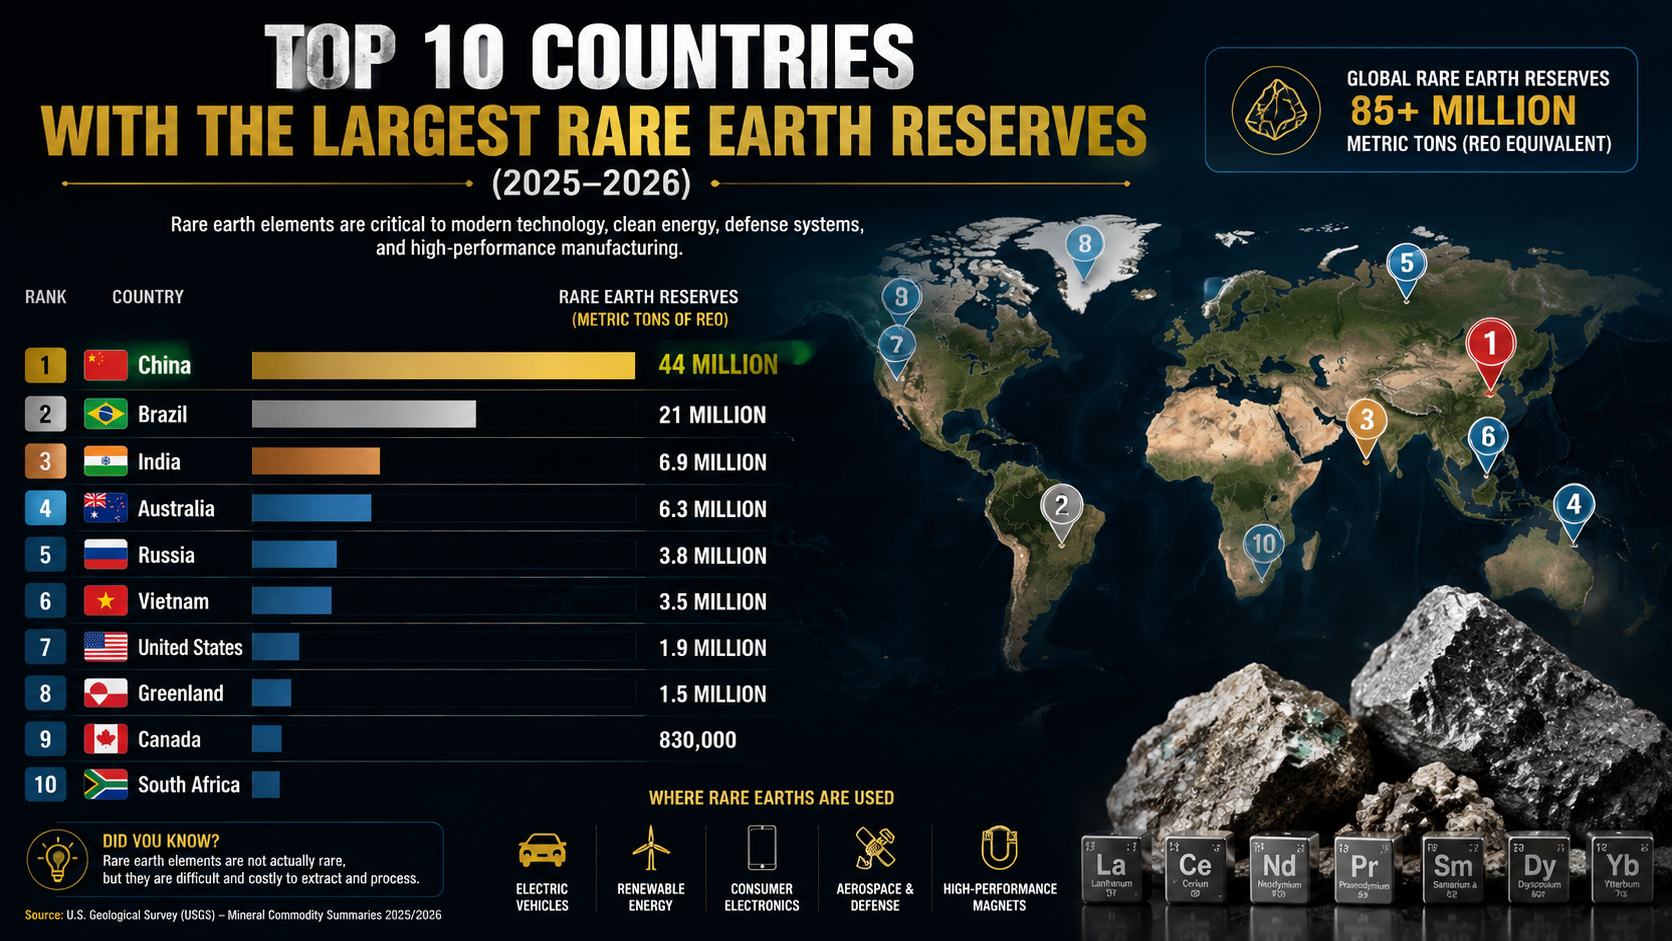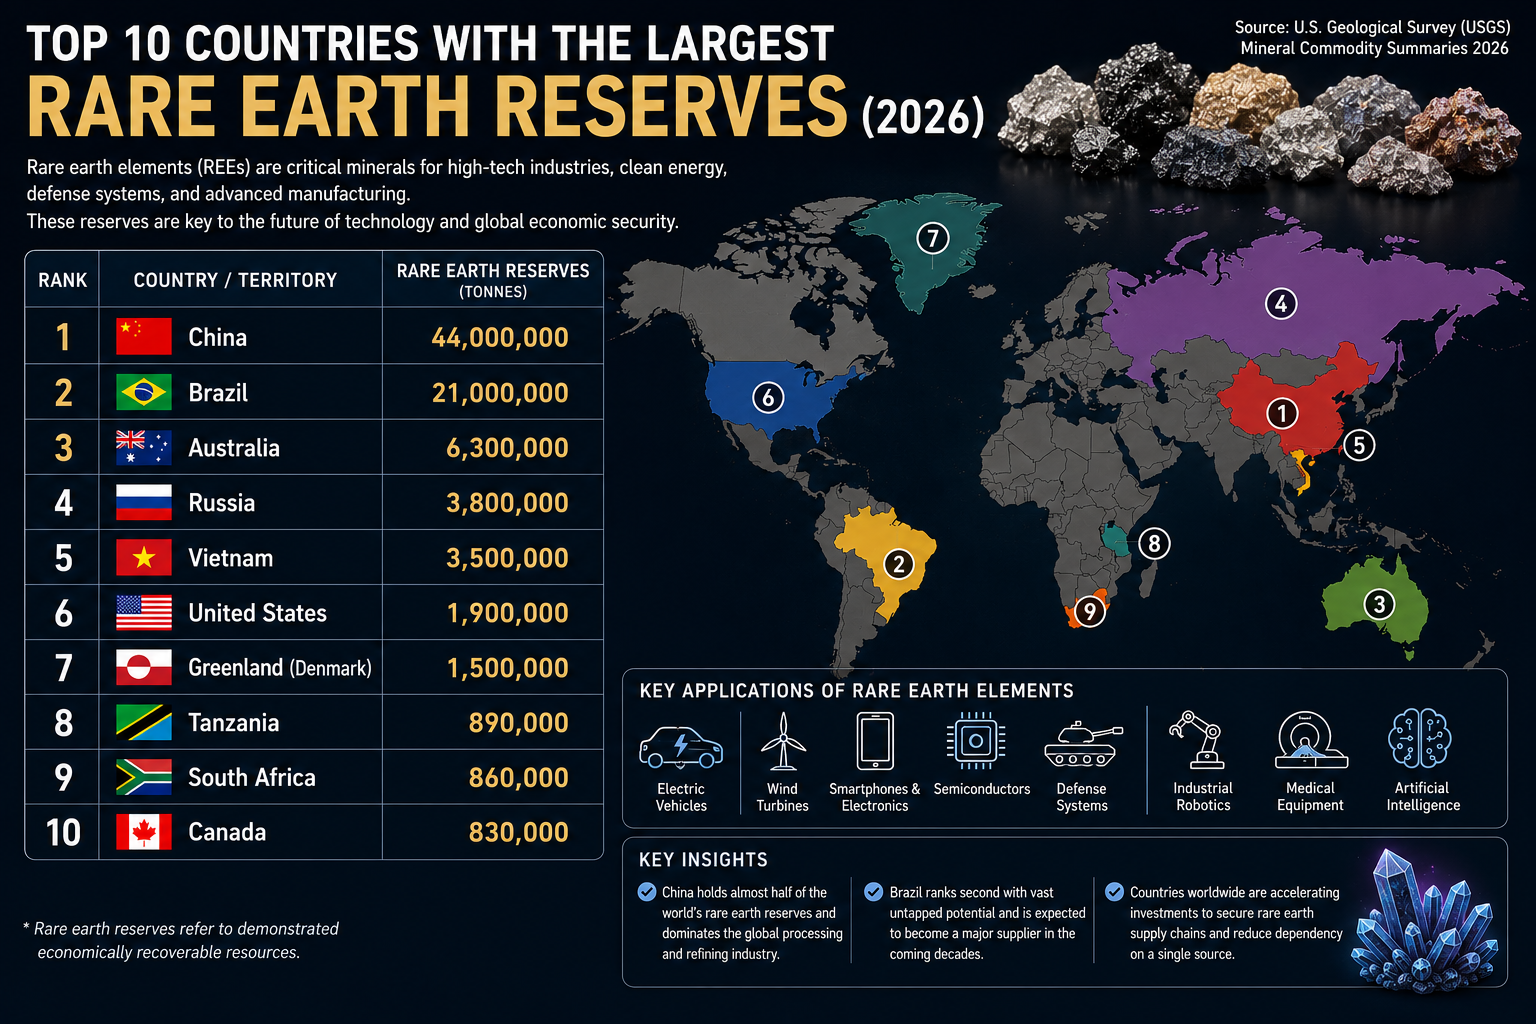
The countries and territories with the largest estimated rare-earth reserves, based on USGS 2026 data.
Updated July 12, 2026. Rare earth elements are essential inputs for electric vehicles, wind turbines, smartphones, semiconductors, industrial robots, medical equipment and advanced defense systems. They are not necessarily rare in the Earth’s crust, but deposits that can be mined economically are concentrated in a relatively small number of places.
According to the U.S. Geological Survey’s Mineral Commodity Summaries 2026, China remains the world’s largest holder of rare-earth reserves, while Brazil ranks second with vast—and still comparatively underdeveloped—potential.
Top 10 Countries With the Largest Rare Earth Reserves in 2026
| Rank | Country or territory | Estimated reserves |
|---|---|---|
| 1 | China | 44.0 million tonnes |
| 2 | Brazil | 21.0 million tonnes |
| 3 | Australia | 6.3 million tonnes |
| 4 | Russia | 3.8 million tonnes |
| 5 | Vietnam | 3.5 million tonnes |
| 6 | United States | 1.9 million tonnes |
| 7 | Greenland (Kingdom of Denmark) | 1.5 million tonnes |
| 8 | Tanzania | 890,000 tonnes |
| 9 | South Africa | 860,000 tonnes |
| 10 | Canada | 830,000 tonnes |
Measurement note: the USGS figures are expressed in metric tonnes of rare-earth-oxide equivalent, commonly abbreviated as REO. The data include lanthanides and yttrium but exclude most scandium.
10. Canada — 830,000 Tonnes
Canada completes the top ten with 830,000 tonnes of USGS-listed reserves. Significant deposits and projects are located in Quebec, the Northwest Territories and other northern regions, but large-scale commercial production remains limited.
The distinction between reserves and resources is particularly important in Canada. The USGS lists 830,000 tonnes as reserves, while measured and indicated resources are much larger. Resources describe a broader geological inventory; reserves are the portion demonstrated to be economically recoverable under current conditions.
Canada is investing in mining, separation, processing and magnet supply chains as the United States and allied economies attempt to diversify critical-mineral sourcing.
9. South Africa — 860,000 Tonnes
South Africa holds an estimated 860,000 tonnes of rare-earth reserves. Deposits are associated with carbonatite complexes and other mineral systems, building on the country’s long experience in hard-rock mining.
Rare-earth development is still far less mature than South Africa’s gold, platinum-group-metal and manganese industries. Projects must overcome financing, infrastructure and processing challenges before the country can become a meaningful global supplier.
8. Tanzania — 890,000 Tonnes
Tanzania ranks eighth with approximately 890,000 tonnes. The Ngualla project in the country’s southwest is one of Africa’s most prominent undeveloped rare-earth projects and is especially associated with neodymium and praseodymium, two elements used in high-performance permanent magnets.
If planned projects move into commercial operation, Tanzania could help diversify supply outside the current dominant producers. Timelines will depend on financing, permitting, infrastructure and the construction of reliable processing routes.
7. Greenland — 1.5 Million Tonnes
Greenland, an autonomous territory within the Kingdom of Denmark, holds an estimated 1.5 million tonnes. Its enormous land area and complex geology have attracted strategic interest from North America and Europe.
However, mineral development in Greenland is exceptionally difficult. Arctic conditions, limited infrastructure, high capital costs, environmental concerns and political debate have delayed or constrained major projects. A large geological deposit does not automatically become a producing mine.
6. United States — 1.9 Million Tonnes
The United States has approximately 1.9 million tonnes of rare-earth reserves. California’s Mountain Pass mine is the country’s leading source and one of the most important rare-earth operations outside China.
U.S. policy now focuses on more than mining. Federal initiatives support domestic separation, refining, recycling, metal and alloy production, and permanent-magnet manufacturing. This matters because a country can mine rare-earth ore yet remain dependent on overseas facilities for the technically demanding stages that convert concentrate into usable materials.
The USGS estimated U.S. mine production at 51,000 tonnes in 2025, making the country a significant producer even though its reserve base ranks sixth.
5. Vietnam — 3.5 Million Tonnes
Vietnam holds an estimated 3.5 million tonnes, placing it fifth. The figure is far below some older estimates, reflecting major revisions in how proven and economically recoverable reserves are assessed.
The country remains strategically important because of its location, geological potential and relationships with manufacturing economies seeking diversified supply. Yet development has been slowed by regulatory, technical and commercial challenges.
Vietnam illustrates why reserve estimates can change sharply: improved geological information, project economics, reporting standards and government reviews can all alter what qualifies as a reserve.
4. Russia — 3.8 Million Tonnes
Russia ranks fourth with 3.8 million tonnes. Its rare-earth potential is concentrated in Siberia, the Arctic and other remote mineral regions.
The country views rare earths as strategically important for defense, aerospace, electronics and other high-technology industries. However, remote deposits, specialized processing requirements, financing constraints and restricted access to some foreign technologies have limited the pace of development.
Russia’s large reserve base therefore does not translate into a comparable share of present global mine production.
3. Australia — 6.3 Million Tonnes
Australia is the leading established rare-earth supplier outside China. Its 6.3 million tonnes of estimated reserves are supported by a mature mining sector, transparent regulation and close commercial ties with Japan, Europe and the United States.
Lynas Rare Earths has helped create a mine-to-processing supply chain centered on the Mount Weld deposit in Western Australia and processing operations in Malaysia and Australia.
The USGS notes an important technical qualification: within the broader 6.3-million-tonne estimate, Joint Ore Reserves Committee-compliant or equivalent reserves were approximately 3.3 million tonnes. This highlights how reserve classifications can vary by reporting framework.
2. Brazil — 21.0 Million Tonnes
Brazil holds the world’s second-largest rare-earth reserve base at 21 million tonnes—nearly one-quarter of the world total identified in the USGS table. Yet estimated 2025 mine production was only about 2,000 tonnes.
This gap between geological scale and present output makes Brazil one of the most important potential growth markets. Its deposits include hard-rock and ionic-clay systems, some of which contain valuable heavy rare earths such as dysprosium and terbium.
Developing the industry will require geological work, project finance, environmental safeguards, infrastructure and technically sophisticated separation capacity. If those pieces come together, Brazil could become a major supplier during the next decade.
1. China — 44.0 Million Tonnes
China leads the world with approximately 44 million tonnes—more than twice Brazil’s total. The country’s strength extends far beyond the size of its reserves.
The USGS estimated that China produced about 270,000 tonnes in 2025, compared with a rounded world total of 390,000 tonnes. China also controls a dominant share of global separation, refining, metal, alloy and permanent-magnet manufacturing capacity.
This downstream advantage is strategically decisive. Mining produces ore or concentrate, but advanced manufacturers need separated oxides, refined metals, alloys and precisely engineered magnets. China’s integrated supply chain connects all of these stages at enormous scale.
Export controls introduced and adjusted during 2025 demonstrated how policy decisions in China can affect global access to heavy rare earths and related technologies.
Why Rare Earth Elements Matter
Rare earths provide magnetic, optical and catalytic properties that are difficult to reproduce efficiently with substitute materials. Important applications include:
- Electric vehicles: neodymium-iron-boron magnets can power compact, efficient traction motors.
- Wind turbines: permanent-magnet generators use rare earths to improve power density and reliability.
- Electronics: rare earths are used in displays, speakers, sensors, polishing materials and components.
- Semiconductors: specialized compounds and polishing powders support chip manufacturing.
- Defense systems: applications include guidance, radar, communications, aircraft and precision motors.
- Medical equipment: rare earths contribute to imaging, lasers and specialized diagnostic technologies.
- Industrial robotics: high-performance magnets enable compact motors and accurate motion control.
- AI infrastructure: data centers, robotics, cooling equipment and power systems depend indirectly on rare-earth-enabled components.
Reserves Are Not the Same as Production or Processing
A large reserve estimate does not guarantee near-term supply. A country must still finance mines, build infrastructure, manage environmental impacts and master complex chemical separation processes.
The 2026 data make this difference clear. Brazil has roughly half of China’s reserve tonnage but only a tiny fraction of its current production. Canada and Greenland have meaningful reserves but no mine production listed in the USGS table. Meanwhile, countries with smaller reserve bases can still play important roles through processing technology and manufacturing.
For that reason, supply-chain security depends on four linked stages: mining, separation and refining, metal and alloy production, and manufacturing of components such as permanent magnets.
Methodology
This ranking uses the reserve estimates in the rare-earths chapter of the USGS Mineral Commodity Summaries 2026, version 1.3 published in May 2026. Figures are stated in metric tonnes of rare-earth-oxide equivalent.
The USGS defines reserves within a resource-classification framework that considers economic and technical recoverability. Estimates may change when prices, technology, geological knowledge, regulations or reporting standards change. Countries shown as “NA” for reserves in the USGS table cannot be ranked and are not assumed to have zero geological potential.
Sources
Primary sources include the U.S. Geological Survey’s full Mineral Commodity Summaries 2026 report, the official Rare Earths Statistics and Information page, and the USGS Mineral Commodity Summaries archive.
Hashtags
#RareEarths #RareEarthElements #CriticalMinerals #China #Brazil #Australia #Russia #Vietnam #UnitedStates #Greenland #Tanzania #SouthAfrica #Canada #ElectricVehicles #CleanEnergy #Semiconductors #ArtificialIntelligence #SupplyChain #Mining #USGS #RankingTour
About the Author