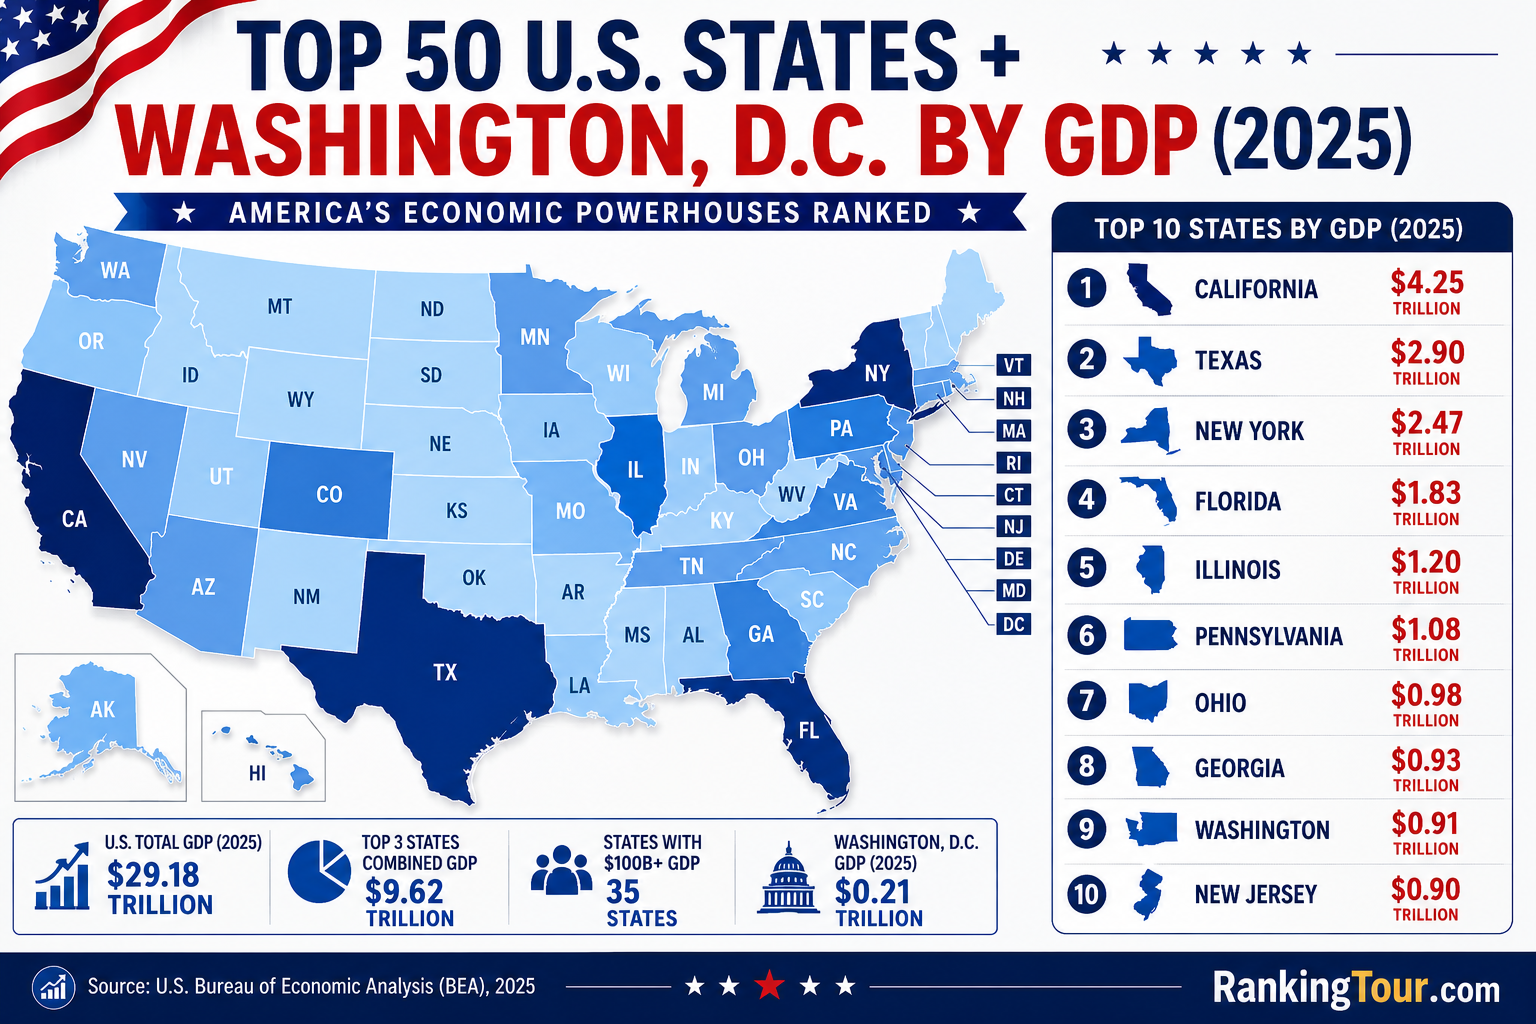
The United States remains the world’s largest economy, but economic activity is distributed unevenly across its states. In 2025, California continues to dominate as the largest state economy, while Texas and New York maintain their positions as America’s second and third economic powerhouses.
This ranking examines the Gross Domestic Product (GDP) of all 50 U.S. states plus Washington, D.C., offering a comprehensive view of America’s economic landscape.
Top 10 U.S. Economies in 2025
| Rank | State | GDP |
|---|---|---|
| 1 | California | $4.25 Trillion |
| 2 | Texas | $2.90 Trillion |
| 3 | New York | $2.47 Trillion |
| 4 | Florida | $1.83 Trillion |
| 5 | Illinois | $1.20 Trillion |
| 6 | Pennsylvania | $1.08 Trillion |
| 7 | Ohio | $0.98 Trillion |
| 8 | Georgia | $0.93 Trillion |
| 9 | Washington | $0.91 Trillion |
| 10 | New Jersey | $0.90 Trillion |
| Rank | State | GDP (USD Trillion) |
|---|---|---|
| 1 | California | 4.25 |
| 2 | Texas | 2.90 |
| 3 | New York | 2.47 |
| 4 | Florida | 1.83 |
| 5 | Illinois | 1.20 |
| 6 | Pennsylvania | 1.08 |
| 7 | Ohio | 0.98 |
| 8 | Georgia | 0.93 |
| 9 | Washington | 0.91 |
| 10 | New Jersey | 0.90 |
| 11 | North Carolina | 0.89 |
| 12 | Massachusetts | 0.85 |
| 13 | Virginia | 0.82 |
| 14 | Michigan | 0.77 |
| 15 | Colorado | 0.60 |
| 16 | Arizona | 0.57 |
| 17 | Tennessee | 0.56 |
| 18 | Indiana | 0.54 |
| 19 | Maryland | 0.52 |
| 20 | Minnesota | 0.51 |
| 21 | Wisconsin | 0.44 |
| 22 | Missouri | 0.43 |
| 23 | South Carolina | 0.38 |
| 24 | Oregon | 0.35 |
| 25 | Connecticut | 0.34 |
| 26 | Louisiana | 0.33 |
| 27 | Utah | 0.32 |
| 28 | Alabama | 0.31 |
| 29 | Kentucky | 0.29 |
| 30 | Oklahoma | 0.28 |
| 31 | Iowa | 0.27 |
| 32 | Nevada | 0.26 |
| 33 | Kansas | 0.24 |
| 34 | Arkansas | 0.19 |
| 35 | Nebraska | 0.18 |
| 36 | Mississippi | 0.16 |
| 37 | New Mexico | 0.15 |
| 38 | Idaho | 0.14 |
| 39 | New Hampshire | 0.13 |
| 40 | Hawaii | 0.12 |
| 41 | West Virginia | 0.11 |
| 42 | Delaware | 0.11 |
| 43 | Maine | 0.10 |
| 44 | Rhode Island | 0.09 |
| 45 | South Dakota | 0.09 |
| 46 | Montana | 0.08 |
| 47 | Alaska | 0.08 |
| 48 | North Dakota | 0.07 |
| 49 | Vermont | 0.05 |
| 50 | Wyoming | 0.05 |
| 51 | District of Columbia (D.C.) | 0.21 |
Key Highlights
California Remains an Economic Giant
With an estimated GDP of $4.25 trillion, California’s economy is larger than that of most countries in the world. The state continues to lead in technology, entertainment, agriculture, and international trade.
Texas Powers Ahead
Texas maintains its position as the second-largest state economy, supported by energy production, advanced manufacturing, technology investment, and strong population growth.
New York’s Financial Dominance
New York remains a global financial center, driven by Wall Street, media, technology, healthcare, and international business services.
Florida Continues Rapid Expansion
Florida has become one of America’s fastest-growing economic hubs, benefiting from population migration, tourism, real estate, and financial services.
The Rise of the Sun Belt
States across the southern United States—including Georgia, North Carolina, Tennessee, and Arizona—continue to attract businesses and residents, contributing to strong economic growth.
Interesting Facts
- California alone generates more than $4 trillion in annual economic output.
- The combined GDP of California, Texas, and New York exceeds $9.6 trillion.
- Washington, D.C., while not a state, would rank among the larger U.S. economies with approximately $210 billion in GDP.
- Technology, finance, healthcare, manufacturing, and energy remain the primary drivers of economic growth nationwide.
Final Thoughts
America’s economic strength is fueled by a diverse mix of industries and regional advantages. While California, Texas, and New York continue to lead, emerging growth across the Sun Belt suggests that the economic map of the United States will continue evolving in the years ahead.
Source: U.S. Bureau of Economic Analysis (BEA), 2025.
")
")
")

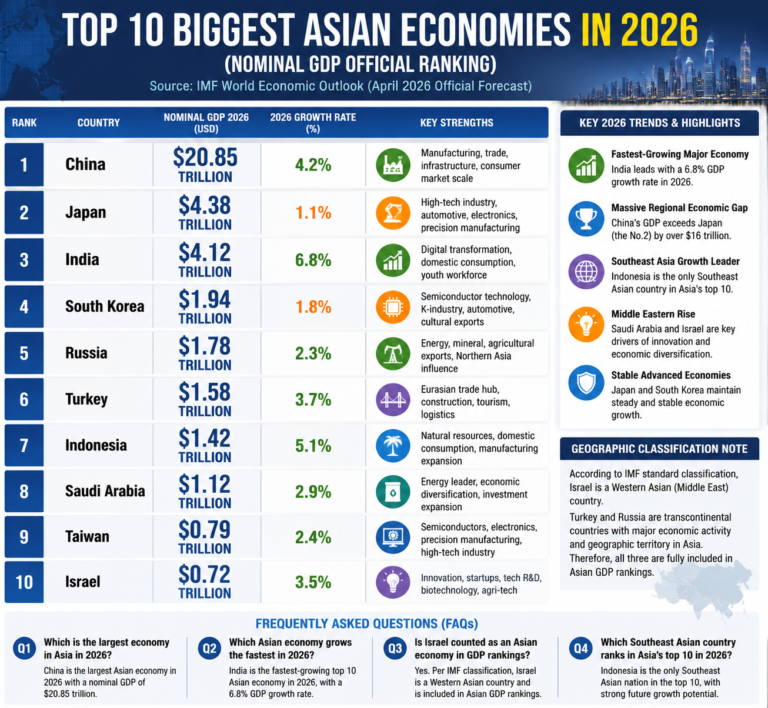
 in 2026")